
The Importance of Maintaining Balance!
Shares that make up a market index, such as the leading 100 share index in the UK, don’t all move together in unison on any given day. The headline index simply tells you at the end of the day what the average move of all the stocks were. But look under the hood, there are generally always stocks moving up or down in price.
Companies in an index are also different sizes – some are very large companies and others are small in comparison. However, very large stocks will have a big influence on the direction of an index. For example, according to MSCI, the top ten companies of the leading UK 100 share index account for just over 48%. This is a very high concentration – as the other 90 shares make up the rest. What happens to these ten companies is therefore vital to investors in this market.
| UK Leading 100 share index | Weight of the Index |
| Shell | 8.77% |
| Astra Zeneca | 8.5% |
| HSBC | 6.09% |
| Unilever | 5.1% |
| BP | 4.36% |
| GSK | 3.61% |
| Diageo | 3.36% |
| RELX | 3.31% |
| RIO Tinto | 2.9% |
| British American Tobacco | 2.49% |
| Total | 48.49% |
| US Leading S&P 500 share index | Weight of the Index |
| Microsoft | 7.08% |
| Apple | 5.63% |
| NVIDIA | 5.05% |
| Amazon | 3.73% |
| Meta (Facebook) | 2.42% |
| Alphabet Class A (Google) | 2.01% |
| Berkshire Hathaway | 1.73% |
| Alphabet Class C (Google) | 1.7% |
| Eli Lilly | 1.4% |
| Broadcom | 1.32% |
| Total | 32.07% |
The leading US index, the S&P 500, also has a relatively high concentration, with the top ten stocks forming over 32%. However, the top ten holdings in the UK include stocks from the Energy sector (BP and Shell), Consumer Staples (including British American Tobacco) and the Financials and Natural sectors (HSBC and Rio Tinto) and for a variety of reasons these stocks have not performed particularly well over the past ten years. Meanwhile, in the US stock market, the top ten holdings are largely made up of well-known technology-related stocks, such as Microsoft and Amazon – which have been performing very well as we transition to a new digital world.
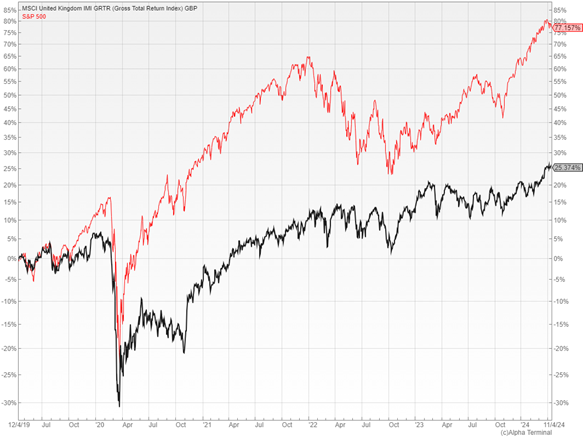
For investors, whether you have invested in UK or US stocks this has made a big difference to your investment returns. The chart below shows that, including dividends, £1,000 invested in the leading UK 100 share index (black line) since 2020 has returned £1,253.74. The S&P 500 (red line) has returned a significantly better £1,771.57 – with a good part of this performance driven by the largest companies.
UK Stock Market
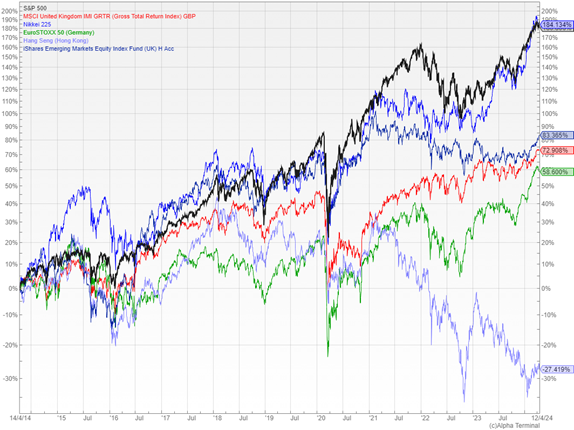
However, it isn’t just the UK stock market that has underperformed. As the chart below shows, over the past 10 years, it is only the Japanese stock market that has come close to doing nearly as well as the US market. Most other global markets have been left in the proverbial dust.
Japanese Stock Market
Home Bias
Historically, many UK investors prefer to invest in UK stocks due to ‘home bias’ – that is, preferring to invest in UK companies that are more familiar. Most UK investors will have heard of GlaxoSmithKline – comparatively few will have heard of Nvidia (which is listed in the US). Often the natural behavioural bias is to invest in what you are more familiar with. But a home bias to UK markets has harmed UK investor returns.
The UK stock market’s underperformance is now being well-publicised in the media and investors are voting with their feet. Calastone, a global funds network company, tracks funds flows and the most recent report for March 2024 shows that:
- UK investors added a record £6.97bn to equity funds in the first quarter of 2024, which is good news. However, £5.72bn of that figure was allocated to North American funds!
- The report noted that more UK investor cash has flowed into North American Equity funds in the last four months than in the previous nine years combined – quite staggering!
- The UK and Asia Pacific (likely driven by negative sentiment towards China) were the only regions to register outflows in March.
Recency Bias
Based on the above, it appears UK investors are now firmly rejecting ‘home bias’ in favour of ‘recency bias’. This is a built-in trait in humans to simplify more complex decisions by focusing only on recent events. For example, in general we would all avoid going for a long ocean swim after watching Jaws, even though the actual risk of being attacked by a shark would remain the same – negligible.
Based on recent performance, UK investors are increasingly giving up on the FTSE stock market. The well-publicised performance of the US stock market has caused investors to place an emphasis on a continuation of that performance.
The dangers of biases
Although cognitive biases are ‘hard-wired’ in our brains, they can often lead to poor decisions and investment mistakes over the long term. Recency bias will encourage investment only in the areas performing well based on history, even if this is counter to their best long term investment interests – such as maintaining investment diversity.
The record inflows into US equity markets is not surprising, given US equity market performance over the past decade or more. The US equity market is at the forefront of technology and innovation and it is also likely being seen as a safe haven in the context of more global uncertainty. With the volume of inflows globally into US markets, strong performance could continue for some time yet.
What are the dangers of current investor trends?
The US market has a high exposure to just 4 of the 11 recognised investment sectors – Information Technology, Financials, Health Care and Consumer Discretionary. These 4 sectors are dominated by a few, very large stocks – the beneficiaries of Artificial Intelligence and Technology are the largest multinational companies – driven by massive economies of scale and global footprint. Investors therefore have comparatively low exposure to the remaining 7 sectors, such as Consumer Staples, Utilities and Industrials.
In other words, by following recent trends, UK investor portfolios are at risk of becoming less diversified.
The last time fund flows from UK investors into North America were as strong as they are now, was in the first quarter of 2021. The outperformance of the US market continued for the rest of that year. However, in 2022, the US stock market was one of the worst performing regions in the world, falling as much as 25%.
Back to balance
There is no suggestion here that the US stock market is about to falter. Notwithstanding the stand-out performance of US stock markets, the basic principles of investing remain – you never know when performance trends will change – investment trends do not announce themselves in advance. It is easy to forget that in 2022, the US was one of the worst performing major stock markets and therefore diversification across a range of sectors, regions and asset classes should remain a priority for investors, especially when markets have risen strongly.
At Raymond James, Richmond, we focus on the next ten years and we pay as much attention to upside potential as downside risk. We prefer to pick the less bumpy, windy road to the destination. This decade, the world order is being challenged in a number of ways which we believe will lead to less certain outcomes and more volatility. We therefore now include investments in our client portfolios that appear now to be acting as true diversifiers against market volatility, such as:
- Gold
- Energy
- Emerging Markets
- Asia Pacific
- Absolute Return Funds
- Infrastructure
These will be the focus of further Taking Stock reports.
Risk warning: With investing, your capital is at risk. Opinions constitute our judgement as of this date and are subject to change without warning. Past performance is not a reliable indicator of future results. This article is intended for informational purposes only and no action should be taken or refrained from being taken as a consequence without consulting a suitably qualified and regulated person.